A Cathode Ray Oscilloscope (CRO) is a fundamental electronic instrument used to visualize electrical signals as waveforms on a screen. Widely used in laboratories and repair work, CROs help engineers measure voltage, frequency, and phase differences with high accuracy. By converting electronic signals into visual representations using electron beams and deflection plates, they serve as the backbone of analog signal analysis. In this guide, we’ll explore the CRO’s working principle, block diagram, components, applications, and how it compares to modern digital oscilloscopes.
What is a CRO?
- The cathode ray oscilloscope (CRO) is generally referred to as an oscilloscope or simply a scope. It is a basic electronic test instrument that allows observations of constantly varying signal voltages, usually as a two-dimensional graph of one or more electrical potential differences, as shown in Fig.1. It allows an electronic engineer to ‘observe’ the signal in various parts of the electronic circuit.
- By ‘observing’ the signal waveforms, the engineers or technicians can correct errors, understand mistakes in the circuit design, and thus make suitable adjustments. The circuit symbol of an oscilloscope is shown in Fig.2.
- A cathode ray oscilloscope, or simply a CRO or oscilloscope, is one of the most useful and versatile tools used in the sciences, medicine, engineering, and the telecommunications industry. These are commonly used to observe the exact wave shape of an electrical signal.
- In addition to the amplitude of the signal, an oscilloscope can show distortion, the time between two events (such as pulse width, period, or rise time), and the relative timing of two related signals.
- Originally, all oscilloscopes used cathode ray tubes(CRTs) as their display element and linear amplifiers for signal processing. However, modern oscilloscopes have LCD or LED screens, fast analog-to-digital converters, and digital signal processors. Some oscilloscopes use storage CRTs to display single events for a limited time.
- These days, oscilloscope peripheral modules are available for general-purpose laptop or desktop personal computers, which allows the laptop or desktop computers to be used as test instruments.
- An oscilloscope allows us to observe the constantly varying signal, usually as a two-dimensional graph of one or more electrical potential differences using the vertical or ‘Y’ axis, plotted as a function of time, (horizontal or ‘X-axis). Although an oscilloscope displays voltage on its vertical axis, any other quantity that can be converted to a voltage can be displayed as well.
- In most instances, oscilloscopes show events that repeat with either no change or change slowly. Whatever the type of oscilloscope, whether CRT, LCD, or LED screen, its front panel normally has control sections divided into Vertical, Horizontal, and Trigger sections. There are also display controls and input connectors.


- An oscilloscope can display and measure many electrical quantities like ac/dc voltage, time, phase relationships, frequency, and a wide range of waveform characteristics like rise-time, fall-time, and overshoot etc. Non-electrical quantities like pressure, strain, temperature, acceleration, etc., can also be measured by using different transducers to first convert them into an equivalent voltage.
Also Read: Measuring Instruments | Classification of Measuring Instruments
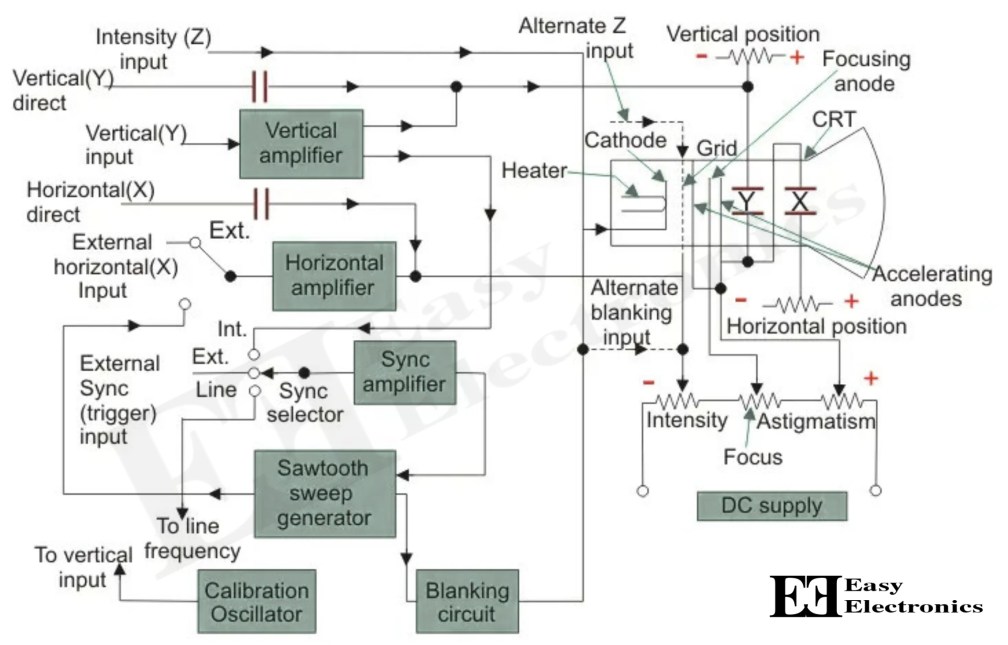
Block Diagram of CRO
Fig.3 shows the block diagram of a CRO. As seen in the diagram, it consists of the following major sub-systems:

| Sr. No. | Sub-Systems | Description |
|---|---|---|
| 1. | Display | All modern oscilloscopes it is usually LCD panels. In the old oscilloscopes, the display was a cathode ray tube or CRT. The display, whether LCD panel or CRT, is laid out with both horizontal and vertical reference lines referred to as the graticule. In addition to the screen, most display sections are equipped with three basic controls, a focus knob, an intensity knob, and a beam finder button. |
| 2. | Cathode Ray Tube (CRT) | This is the cathode ray tube that emits electrons that strike the phosphor screen internally to provide a visual display of the signal. It displays the quantity being measured. |
| 3. | Vertical amplifier | It amplifies the signal waveform to be viewed. |
| 4. | Delay Line | It is used to delay the signal for some time in the vertical sections. |
| 5. | Horizontal amplifier | This is used to amplify the sawtooth voltage, which is then applied to the X-plates. |
| 6. | Sweep generator | Produces a sawtooth voltage waveform used for horizontal deflection of the electron beam. |
| 7. | Trigger circuit | Produces trigger pulses to start the horizontal sweep. It converts the incoming signal into trigger pulses so that the input signal and the sweep frequency can be synchronized. |
| 8. | High and low Voltage power supply | Two voltages are generated in the CRO (a) The low voltage supply is from +300 to 400 V. (b) The high voltage supply is from –1000 to –1500 V. |
Also Read: Errors in Measurement: Gross Errors, Systematic Errors, and Random Errors
Operation Control of Oscilloscope
The operating controls of a basic oscilloscope are shown in Fig.4. The different terminals provide.
- Horizontal Amplifier Input
- Vertical Amplifier Input
- Synchronous Input
- External Sweep Input.

| Sr. No. | Controls | Description |
|---|---|---|
| 1. | Intensity | For the correct brightness of the trace on the screen. This adjusts trace brightness. Slow traces on CRT scopes need less, and fast ones, especially if they don’t repeat very often, require more. On flat panels, however, trace brightness is essentially independent of sweep speed, because the internal signal processing effectively synthesizes the display from the digitized data. |
| 2. | Focus | For the sharp focus of the trace. This control adjusts CRT focus to obtain the sharpest, most detailed trace. In practice, the focus needs to be adjusted slightly when observing quite different signals, which means that it needs to be an external control. Flat-panel displays do not need a focus control; their sharpness is always optimum. |
| 3. | Horizontal centering | For moving the pattern right and left on the screen. The horizontal position control moves the display sideways. It usually sets the left end of the trace at the left edge of the graticule, but it can displace the whole trace when desired. This control also moves the X-Y mode traces sidewise in some scopes, and can compensate for a limited DC component for the vertical position |
| 4. | Vertical centering | For moving the pattern up and down on the screen. The vertical position control moves the whole displayed trace up and down. It is used to set the no-input trace exactly on the center line of the graticule, but also permits offsetting vertically by a limited amount. With direct coupling, adjustment of this control can compensate for a limited DC component of the input. |
| 5. | Horizontal gain (also Time/div or Time/cm) | For adjusting the pattern width. This section controls the time base or “sweep” of the instrument. The primary control is the Seconds-per-Division (Sec/Div) selector switch. Also included is a horizontal input for plotting dual X-Y axis signals. The horizontal beam position knob is generally located in this section. |
| 6. | Vertical gain (also volt/div or volt/cm). | For adjusting the pattern height. This controls the amplitude of the displayed signal. This section carries a Volts-per-Division (Volts/Div) selector knob, an AC/DC/Ground selector switch, and the vertical (primary) input for the instrument. Additionally, this section is typically equipped with a vertical beam position knob. |
| 7. | Sweep frequency | For selecting several cycles in the pattern. |
| 8. | Sync. Voltage amplitude. | For locking the pattern |
Also Read: PMMC Instrument: Construction, Working & Its Applications
CRO Working
Think of a CRO like a live ECG for electricity. It captures how voltage behaves over time and draws it as a moving line on a screen. Inside, an electron beam zips across a glowing screen and shifts based on the signal you feed into it.
The result? You literally see electricity in action — waveforms, pulses, spikes, anything!
🎯 Vertical Deflection System
This handles your input signal — it’s where the magic begins.
- The signal gets amplified (if it’s weak).
- It then moves the beam up or down, based on voltage.
- The higher the voltage, the higher the jump on the screen.
This creates the Y-axis movement of your waveform.
⏱️ Horizontal Deflection System
This section deals with time ⏳
- It makes the beam sweep left to right like a scanner.
- This creates the X-axis — time scale.
- A sawtooth wave (ramp waveform) controls this smooth sweep.
Together with the vertical system, you get a time vs voltage graph — your signal in motion!
🔁 Recurrent Sweep
It’s like looped video playback.
Every time the sweep ends, a new one starts automatically.
Perfect for signals that repeat again and again like sine waves.
🧪 Used in: Sound waves, signal generators, and testing AC supply.
🧲 Triggered Sweep
Here, the sweep waits for a signal to hit a trigger point — then it moves.
Useful when signals are random or irregular (like a heartbeat or digital data pulses).
🎯 Think of it like “start recording only when something important happens.”
🧪 Driven Sweep
Here, the signal itself controls the sweep.
No time base. No sawtooth.
The waveform decides how and when the beam moves.
🎛 Used when signal timing can’t be predicted.
🚫 Non-Saw Tooth Sweep
Not every signal likes a straight line.
Instead of linear motion, this uses custom sweep shapes — maybe exponential or sinusoidal.
🧠 Ideal for comparing signals of different frequencies or analyzing complex patterns.
🔄 Synchronization
This keeps your waveform stable and still — not drifting like a ghost.
Choose how you want to sync:
- Internal: Uses your input signal
- External: Uses another device
- Line: Uses 50/60 Hz power source
🧩 Without sync, your waveform would just float across the screen.
🌟 Intensity Modulation
Want to brighten parts of the signal?
Feed a signal between cathode and ground to control beam brightness dynamically.
Great for highlighting events or adding contrast.
🎚️ Positioning Control
These knobs let you move the waveform up, down, left, or right — just like sliding a graph on paper.
Doesn’t affect your signal — just changes how you view it on the screen.
Super useful when comparing multiple signals.
💡 Intensity Control
Not too bright, not too dim.
This adjusts the overall brightness by changing how many electrons hit the screen.
Helps avoid screen burn and makes waveforms easier to see.
⚡ Electrical Quantities Measurements using CRO
A Cathode Ray Oscilloscope (CRO) isn’t just for pretty waveforms — it can actually measure key electrical quantities like:
✅ Amplitude (Voltage)
✅ Time Period
✅ Frequency
Let’s break it down 👇
📏 Measurement of Amplitude
Want to know how high your voltage signal goes? That’s the amplitude.
- Count how many vertical divisions the waveform spans.
- Multiply it by the Volt/Div setting on the CRO.
📐 Formula:A = j × nv
Where:
A= Amplitudej= Volt/division settingnv= Number of vertical divisions the waveform spans
📘 Example: If signal covers 3 divisions and Volt/div is set to 2V/div:
→ A = 2 × 3 = 6V
⏱️ Measurement of Time Period
Time period tells you how long one cycle of the waveform lasts.
- Count the horizontal divisions for one full cycle.
- Multiply it by the Time/Div setting.
📐 Formula:T = k × nh
Where:
T= Time periodk= Time/division settingnh= Number of horizontal divisions covering one full cycle
📘 Example: If 4 divisions × 0.5 ms/div:
→ T = 0.5 × 4 = 2 ms
🔁 Measurement of Frequency
Frequency is how often the signal repeats per second.
Just use the inverse of the time period:
📐 Formula:f = 1 / T
📘 Example:
If T = 2 ms = 0.002 sec
→ f = 1 / 0.002 = 500 Hz
💡 Pro Tip: To get better accuracy, zoom into the waveform using appropriate Volt/Div and Time/Div settings. A stretched signal is easier to measure precisely!
🚀 Applications of CRO (Cathode Ray Oscilloscope)
A CRO isn’t just for labs — it’s a powerful multipurpose tool used across science, engineering, and even medical fields. Here’s where it shines:
🔸 Signal Monitoring: Used in radio and TV broadcasting to visualize and analyze transmission signals.
🔸 Circuit Testing: Helps engineers see how voltages and currents behave in real time.
🔸 Measuring Electrical Quantities:
CRO can measure:
- Voltage
- Current
- Frequency
- Inductance
- Resistance
- Capacitance
- Power factor
- Phase difference
🔸 Communication Systems: To test AM/FM waveforms, frequency response, and signal distortion.
🔸 Medical Applications: Used in ECG machines to track heartbeats and nerve responses.
🔸 Radar and TV Systems: To analyze timing and waveform behavior in complex circuits.
🔸 Hysteresis & BH Curve Testing: For magnetic material testing.
🔸 Transistor & Diode Testing: CROs can trace transistor characteristics or check signal rectification.
🔸 R&D Labs: Researchers use CROs to validate and debug new electronic designs.
✅ Advantages of CRO
Here’s why engineers love CROs:
🟢 Real-time Signal Visualization
🟢 Accurate Measurement of Amplitude, Frequency & Time
🟢 Ideal for Troubleshooting Circuits
🟢 Works for Both AC & DC Signals
🟢 No Need for Calibration (if analog CRO)
🟢 Visual Comparison of Multiple Signals
🟢 Detects Noise, Glitches, and Distortion
⚠️ Disadvantages of CRO
But it’s not perfect — here are the trade-offs:
🔴 Bulky & Power-Hungry (especially analog CROs)
🔴 Hard to Repair & Calibrate
🔴 Complex Controls for Beginners
🔴 Expensive Compared to Multimeters
🔴 Lacks Memory (unlike Digital Storage Oscilloscopes – DSO)
💡 Tip: For multi-channel signals, go for a DSO instead of a traditional CRO.
🔍 Common Uses of CRO in Labs
Here’s what students and researchers often do with a CRO:
📌 View and study waveforms
📌 Compare two signals side by side
📌 Measure voltage or potential difference like a voltmeter
📌 Observe short-duration pulses or timing differences
📌 Analyze logic signals in digital circuits
Frequently Asked Questions on CRO
What is CRO and its application?
A CRO is used to display and analyze electrical waveforms. Applications include signal testing, frequency analysis, and waveform measurement.
How does the cathode ray oscilloscope work?
The CRO recruits the cathode ray tube and acts as the heat of the oscilloscope. In an oscilloscope, the CRT produces the electron beam which is accelerated to a high velocity and brought to the focal point on a fluorescent screen. Thus, the screen produces a visible spot where the electron beam strikes with it
What is the application of CRO?
CRO applications are mainly involved in radio, and TV receivers, also in laboratory work involving research and design. In modern electronics, the CRO plays an important role in electronic circuits.
What are the three types of oscilloscopes?
Digital storage oscilloscopes (DSO), Digital phosphor oscilloscopes (DPO), Mixed signal oscilloscopes (MSO)
What is the function of CRO in electronics?
It converts electrical signals into visual waveforms for analysis.
Difference between CRO and DSO?
CRO uses analog CRT display, while DSO offers digital waveform capture and analysis.